171+ checkpoints in 70+ countries on six continents
Fastest check
Every 30 seconds (Professional and Enterprise plans)
Monitor types
Uptime, transaction, API, heartbeat, server, page speed, real user monitoring, SSL, domain expiry, DNS, malware and blacklist
Alert channels
Email, SMS, Slack, Microsoft Teams, Discord, Mattermost, Telegram, WhatsApp, PagerDuty, Twilio, Atlassian Statuspage and webhooks
Pricing
Basic $9, Professional $39, Enterprise $199 per month, billed annually (monthly billing $10 / $45 / $229)
Free trial
30 days, no credit card required
Built for
Small and mid-sized businesses, SaaS companies, online stores, web agencies and IT teams
Website languages
English, German, French, Spanish, Italian, Portuguese, Dutch and Lithuanian
Data protection
EU company, GDPR-compliant
Ready-to-paste descriptions
Each text fits the character limit of a common listing form. Capterra and GetApp reject text that already appears on another site, so the long description comes in two versions.
Product name
Uptimia
7 characters
Tagline
Downtime alerts before your customers notice
44 characters · fits a 60-character field
One-line description
Checks websites, APIs and servers from 171 locations in 70+ countries, with grouped alerts, incident history and public status pages.
133 characters · fits a 135-character field
Target market
Online stores, SaaS companies, web agencies and IT teams that lose sales or customers when a website, API or server goes down or gets slow.
139 characters · fits a 200-character field
Short description
Uptimia checks websites, APIs, servers, SSL certificates and domain names from 171 locations. When one outage breaks several monitors, your team gets a single alert in Slack, Teams or wherever it already works. A public status page and uptime reports are included.
264 characters · fits a 300-character field
Company boilerplate
For the end of a press release or article.
Uptimia is a monitoring service run by JJ Online GmbH in Berlin, Germany. It has been checking websites, APIs and servers since 2015 and now watches more than 100,000 websites from 171+ locations in 70+ countries. When something breaks, it alerts teams by email, SMS, Slack, Microsoft Teams and other channels. More at www.uptimia.com.
335 characters
Long description (variant A)
Checks run from 171 locations in more than 70 countries, as often as every 30 seconds. Watch uptime, page load speed, login and checkout flows, real visitor load times, APIs, servers and scheduled jobs. SSL expiry, domain renewals, DNS records, blacklists and malware are covered too.
Alerts go by email, SMS, Slack, Microsoft Teams, PagerDuty, Discord, Telegram, WhatsApp or webhook. Say a hosting fault takes down twelve monitors at 3 a.m.: you get one incident, not twelve messages. Escalation stops once someone acknowledges it.
Every plan has status pages with your logo, for incident updates and planned maintenance. Reports show availability, downtime and mean time to recovery, and split response time into DNS lookup, connection and time to first byte. Export any of it to CSV.
Sort monitors by client or environment in one dashboard. The trial lasts 30 days. No card needed.
887 characters · fits a 1000-character field
Long description (variant B)
Uptimia is for anyone who runs a website that has to stay up: online stores, SaaS products, agencies with client sites, internal IT. It tests your services from 171 locations in 70+ countries and tells you the moment something fails or slows down.
What it checks:
- Websites and HTTP endpoints, every 30 seconds if you want
- Page speed, plus the load times your real visitors get
- Flows with several steps, such as logging in, searching or paying
- APIs, servers, and cron jobs or background workers through heartbeats
- SSL certificates, domain expiry, DNS changes, blacklist entries and malware
A failed check reaches you by email, SMS, Slack, Microsoft Teams, PagerDuty, Discord, Telegram, WhatsApp or webhook. One root cause that trips ten monitors becomes one incident with one digest alert. Whoever picks it up acknowledges it, the escalation stops, and a recovery notice closes it when the service is back.
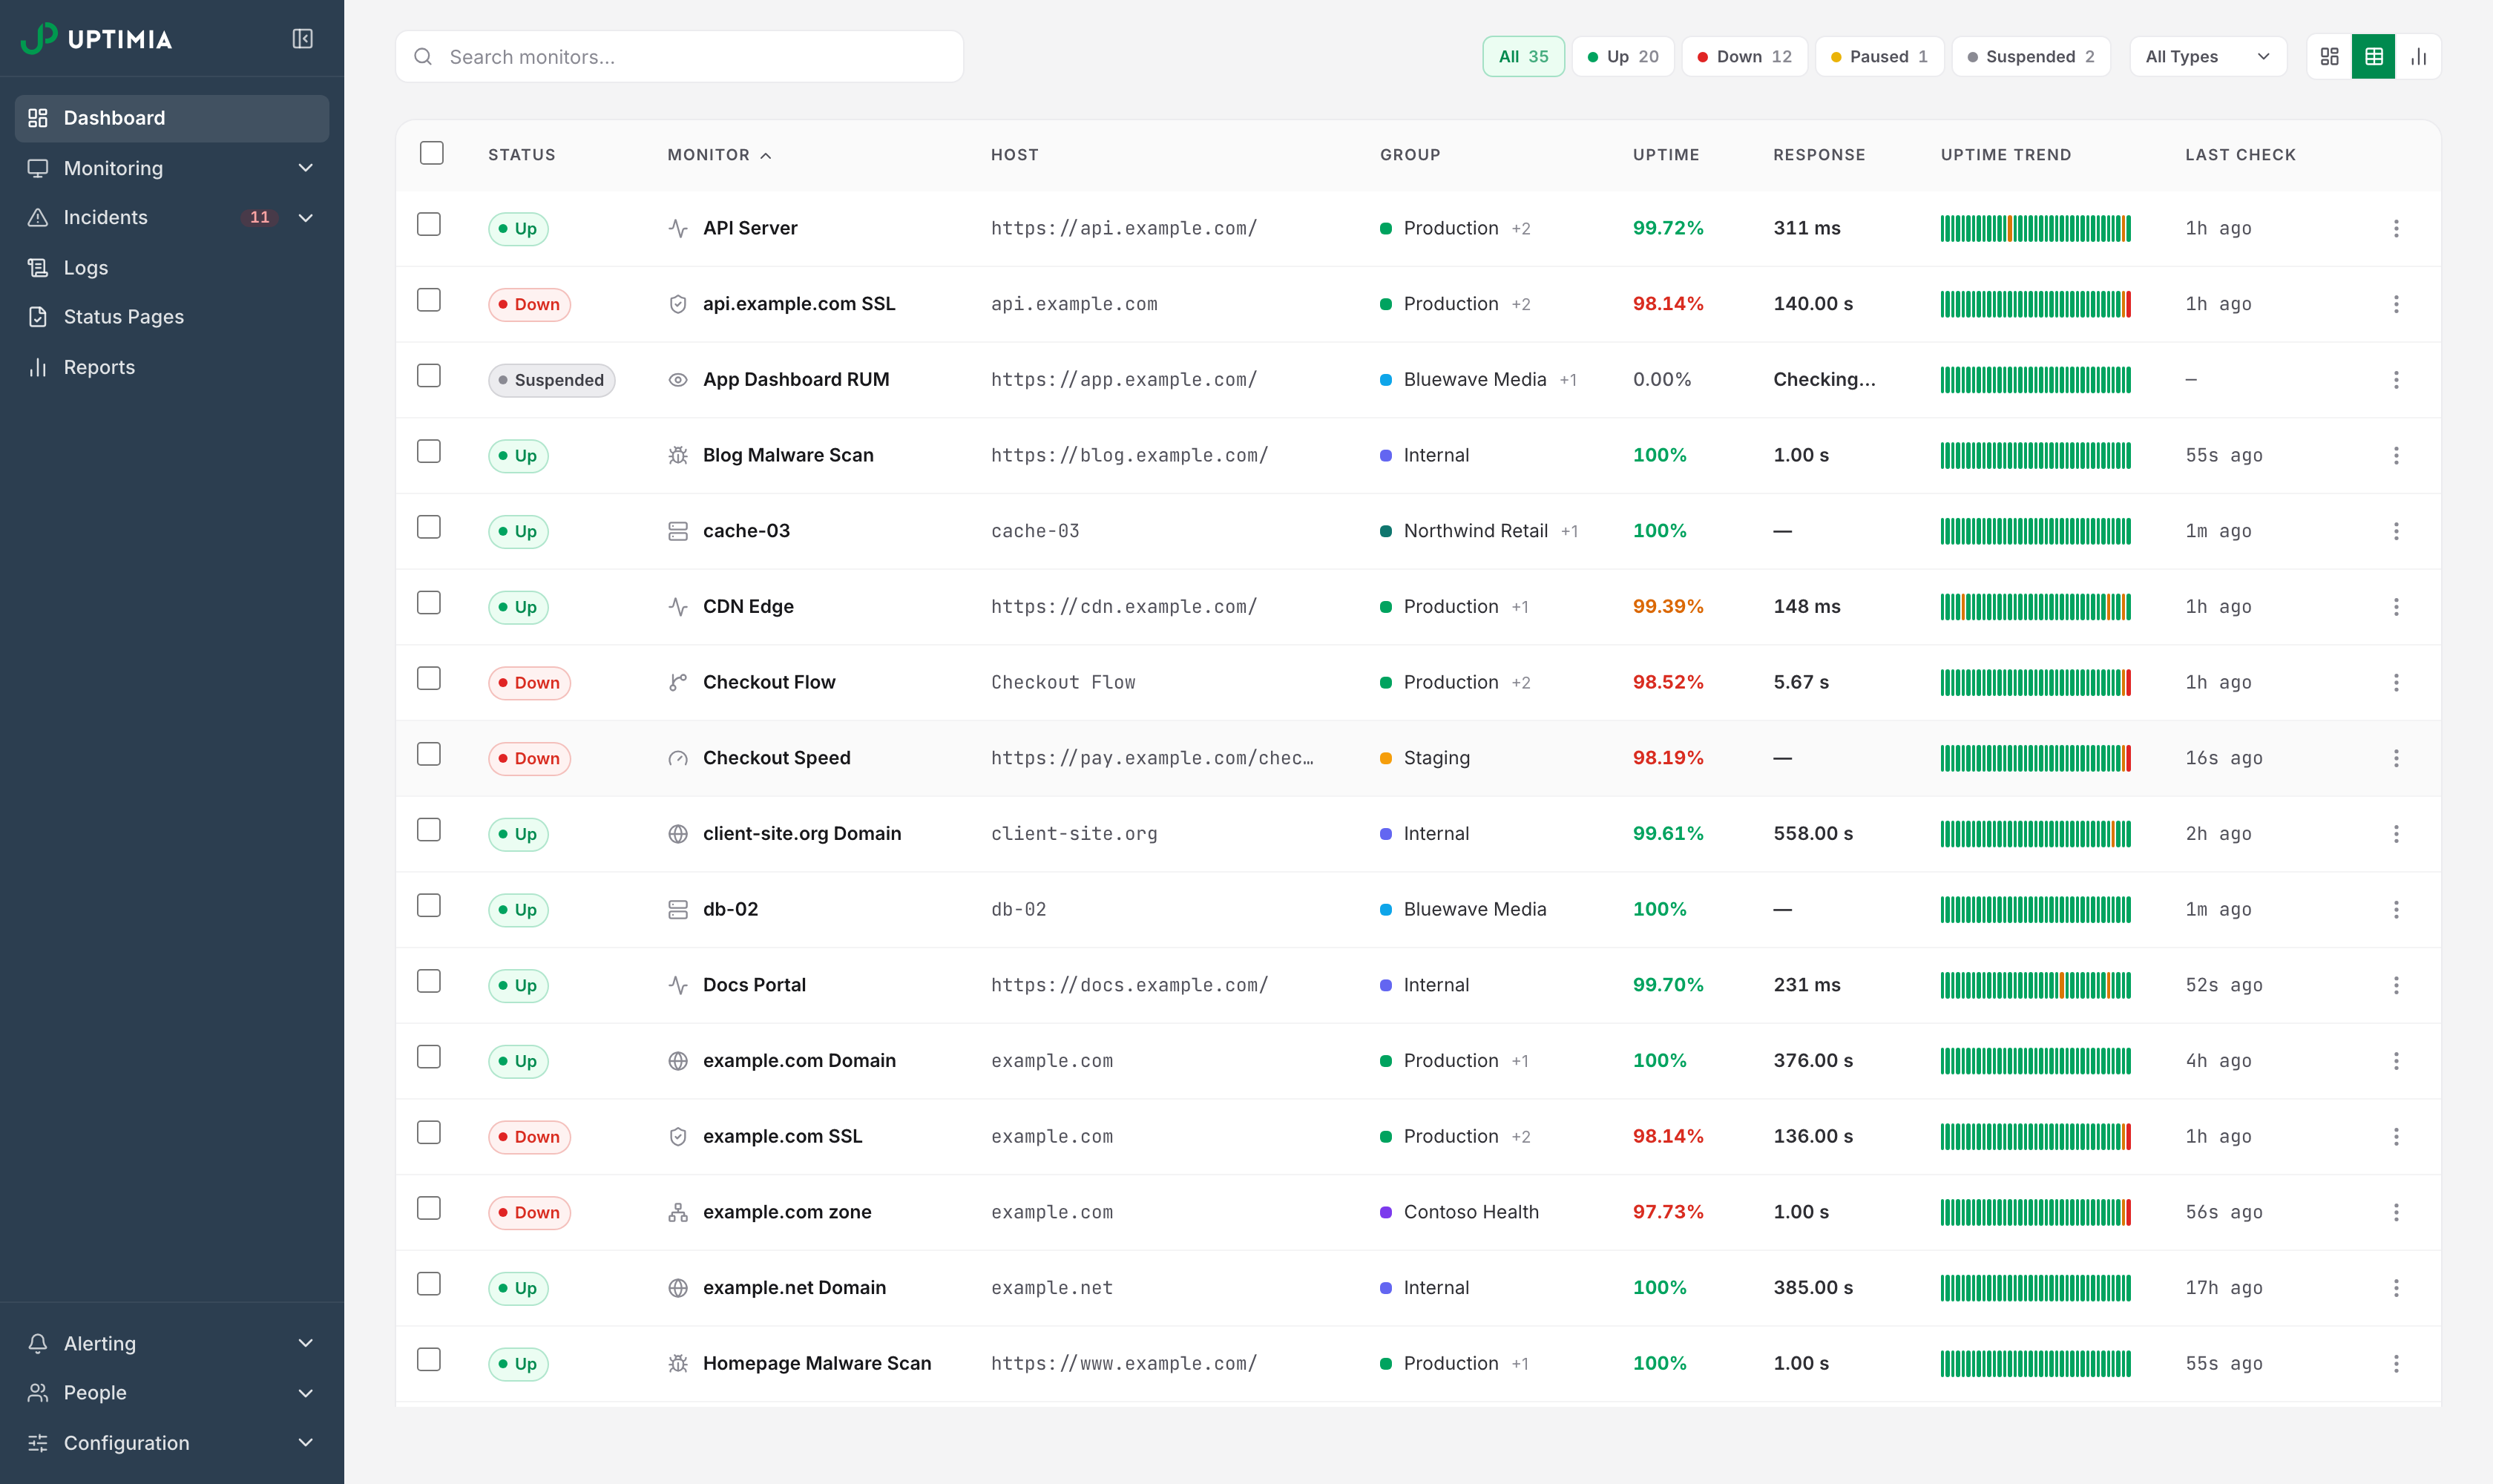
The dashboard puts every monitor on one screen, grouped by client, product or environment. Open a monitor to see its availability, uptime timeline and incidents. The response time chart breaks each request into DNS lookup, connect, send, wait (time to first byte) and receive, so a slow page points to its cause. Incident history totals the downtime and the mean time to recovery. Export it to CSV.
Each plan includes public status pages. They show 90 days of uptime per component, incident updates and upcoming maintenance, and customers can subscribe for updates. Add your logo and serve the page on your own domain.
Paid plans start at $9 a month on annual billing. Sign up without a card and use everything free for 30 days.
1649 characters · fits a 4000-character field
Key benefits
You find out first. With checks running from 171 locations, a regional outage, a slow page or a broken checkout reaches you within minutes. Customers don't have to tell you.
One alert per problem. If a single cause takes down eight monitors, Uptimia sends one grouped alert, not eight. After someone acknowledges the incident, the repeats and the escalation stop. Nobody gets woken ten times for the same fault.
Fewer tools to pay for. Uptime, page speed, transactions, APIs, cron jobs, servers, SSL, domains, DNS and blacklists share one dashboard and one set of alert rules. You can drop the separate SSL checker, cron monitor and status page service.
Faster fixes. Each request's timing is split into DNS, connect, time to first byte and download, so you see which step is slow. Every incident records the error, how long it lasted and who acknowledged it, and Uptimia totals downtime and mean time to recovery.
Fewer "is it down?" tickets. Your public status page carries your logo, the live status, incident updates and planned maintenance.
Made for agencies. Group monitors by client or environment and spot the group with a problem at a glance.
Nothing to lose trying it. The 30-day trial needs no card.
1216 characters · fits a 4000-character field
Key features
- Website and HTTP endpoint checks as often as every 30 seconds
- Multi-step transaction checks for login, search and checkout flows
- API checks with your own methods, headers and response rules
- Heartbeats that alert when a cron job or background worker stops reporting
- Server monitoring with disk, resource and offline alerts
- Page speed tests and real user monitoring
- SSL certificate, domain expiry, DNS, blacklist and malware checks
- 171+ checkpoints in 70+ countries
- Alerts by email, SMS, Slack, Microsoft Teams, Discord, Mattermost, Telegram, WhatsApp, PagerDuty and webhooks
- Incident grouping, acknowledgement and escalation policies
- Maintenance windows that silence alerts
- Public status pages with your logo and domain
- Availability and response time reports, exportable to CSV
- Team accounts and a REST API
833 characters
Categories
Website Monitoring, Uptime Monitoring, Server Monitoring, API Monitoring, Synthetic Monitoring, Real User Monitoring, SSL Certificate Monitoring, Status Page, Incident Management
178 characters
Logos
SVG for print and the web. PNG with a transparent background for everything else.
Write the name as Uptimia: one word, capital U only. Not UPTIMIA, UptimIA or Uptimia.com.
Leave clear space around the logo equal to half the icon's height.
Don't recolour, stretch or rotate the logo, and don't add effects.
Use the logo at 100 px wide or larger. Below that, use the icon on its own.
Brand colours
Uptimia green#2BB371
Deep green#007E42
Graphite#3A3A39
Dark#2A2C30
Product screenshots
Retina PNGs from the Uptimia control panel. The monitors and companies in them are sample data.
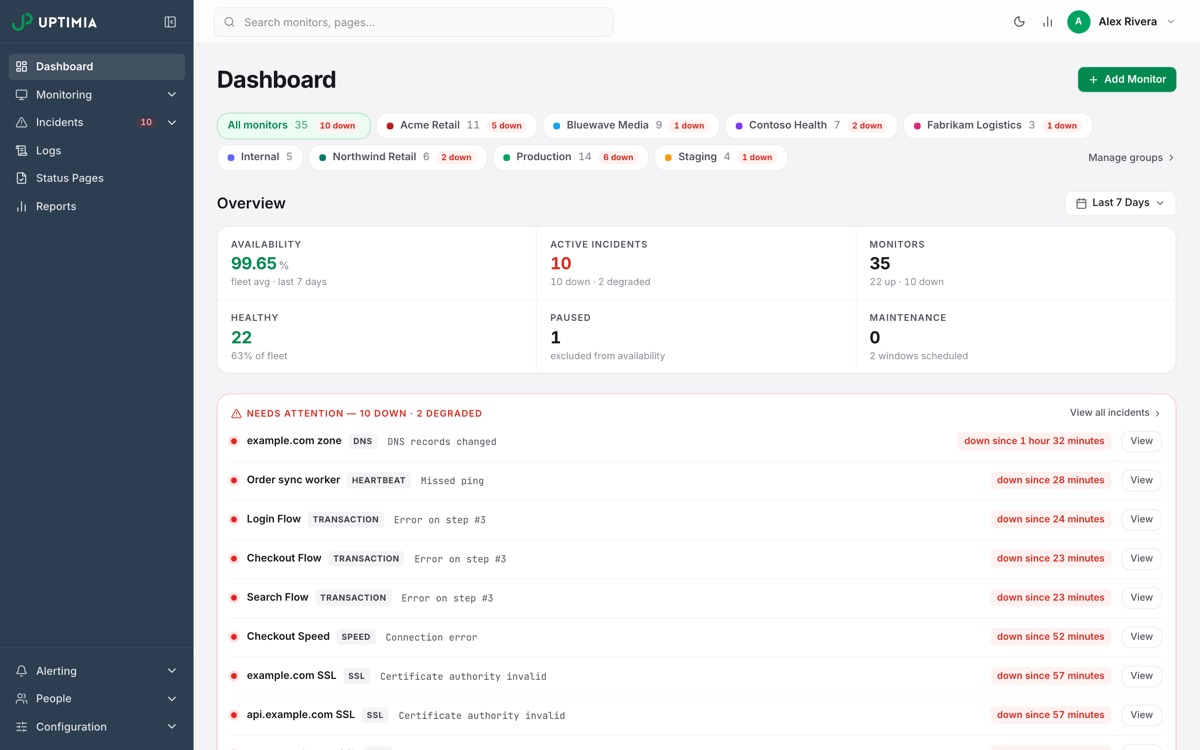
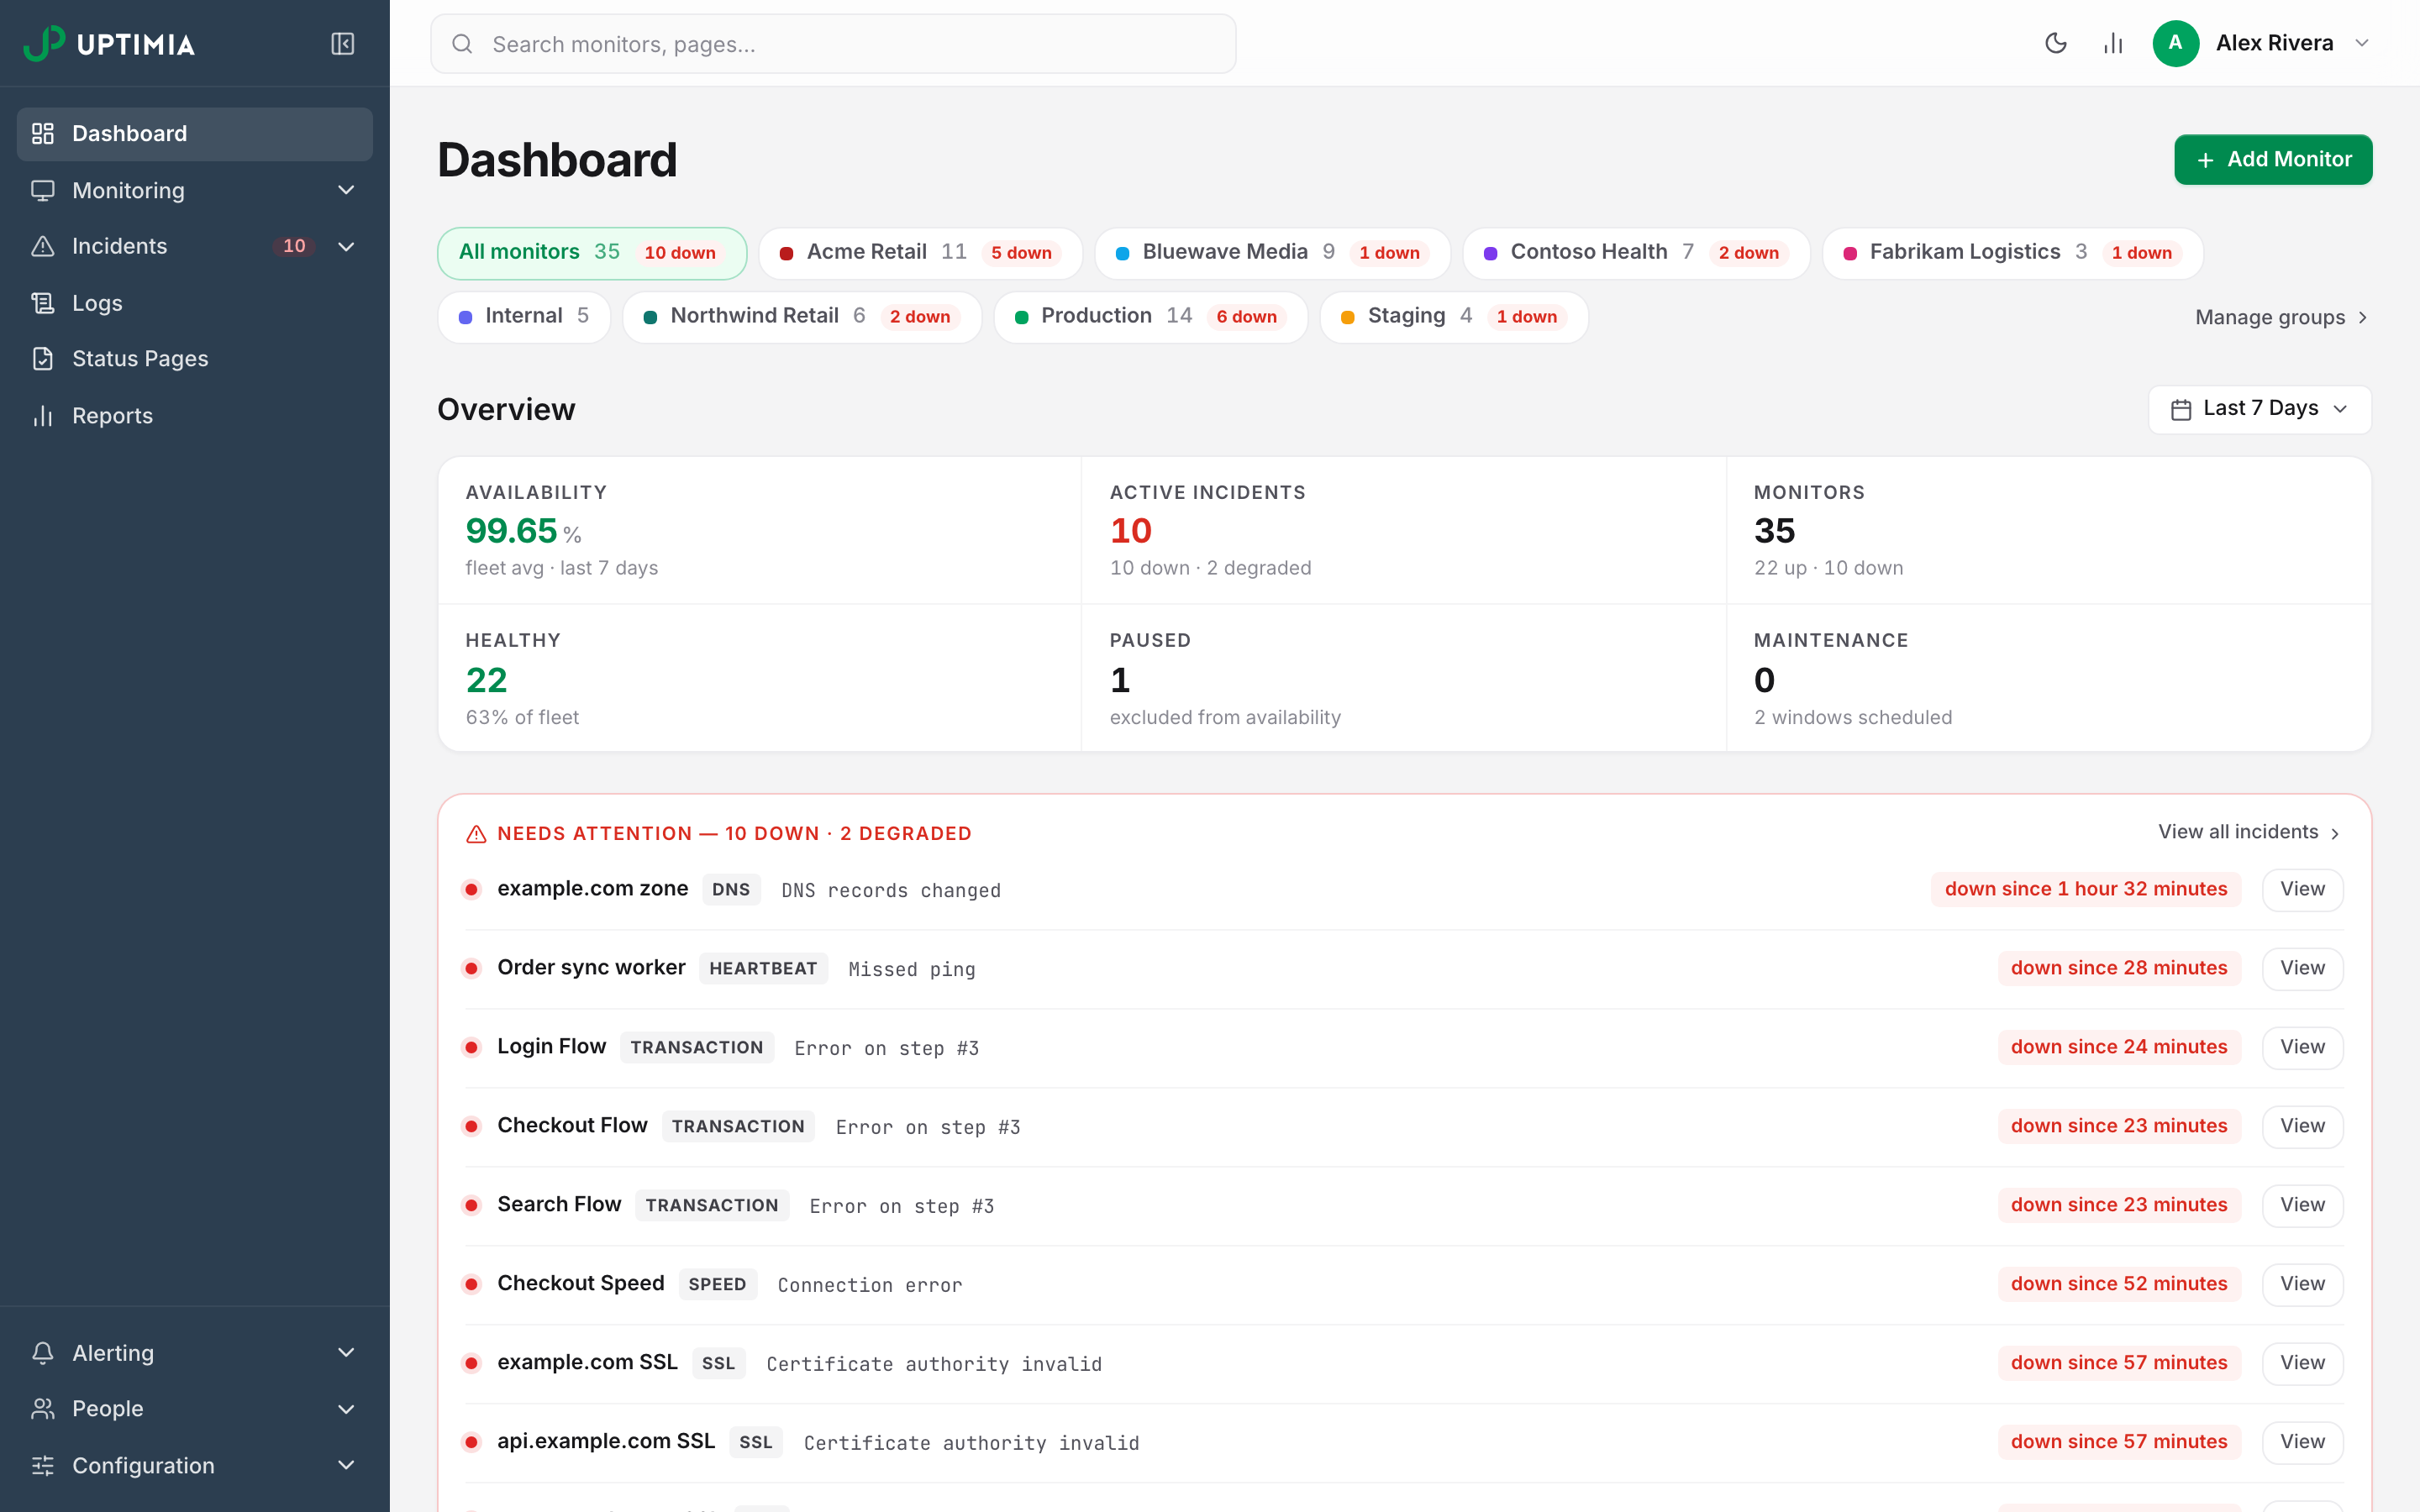
Dashboard with fleet-wide availability and open issues
All monitors on one screen. Filter by client or environment, check availability, open incidents and planned maintenance, and go straight to whatever is down.
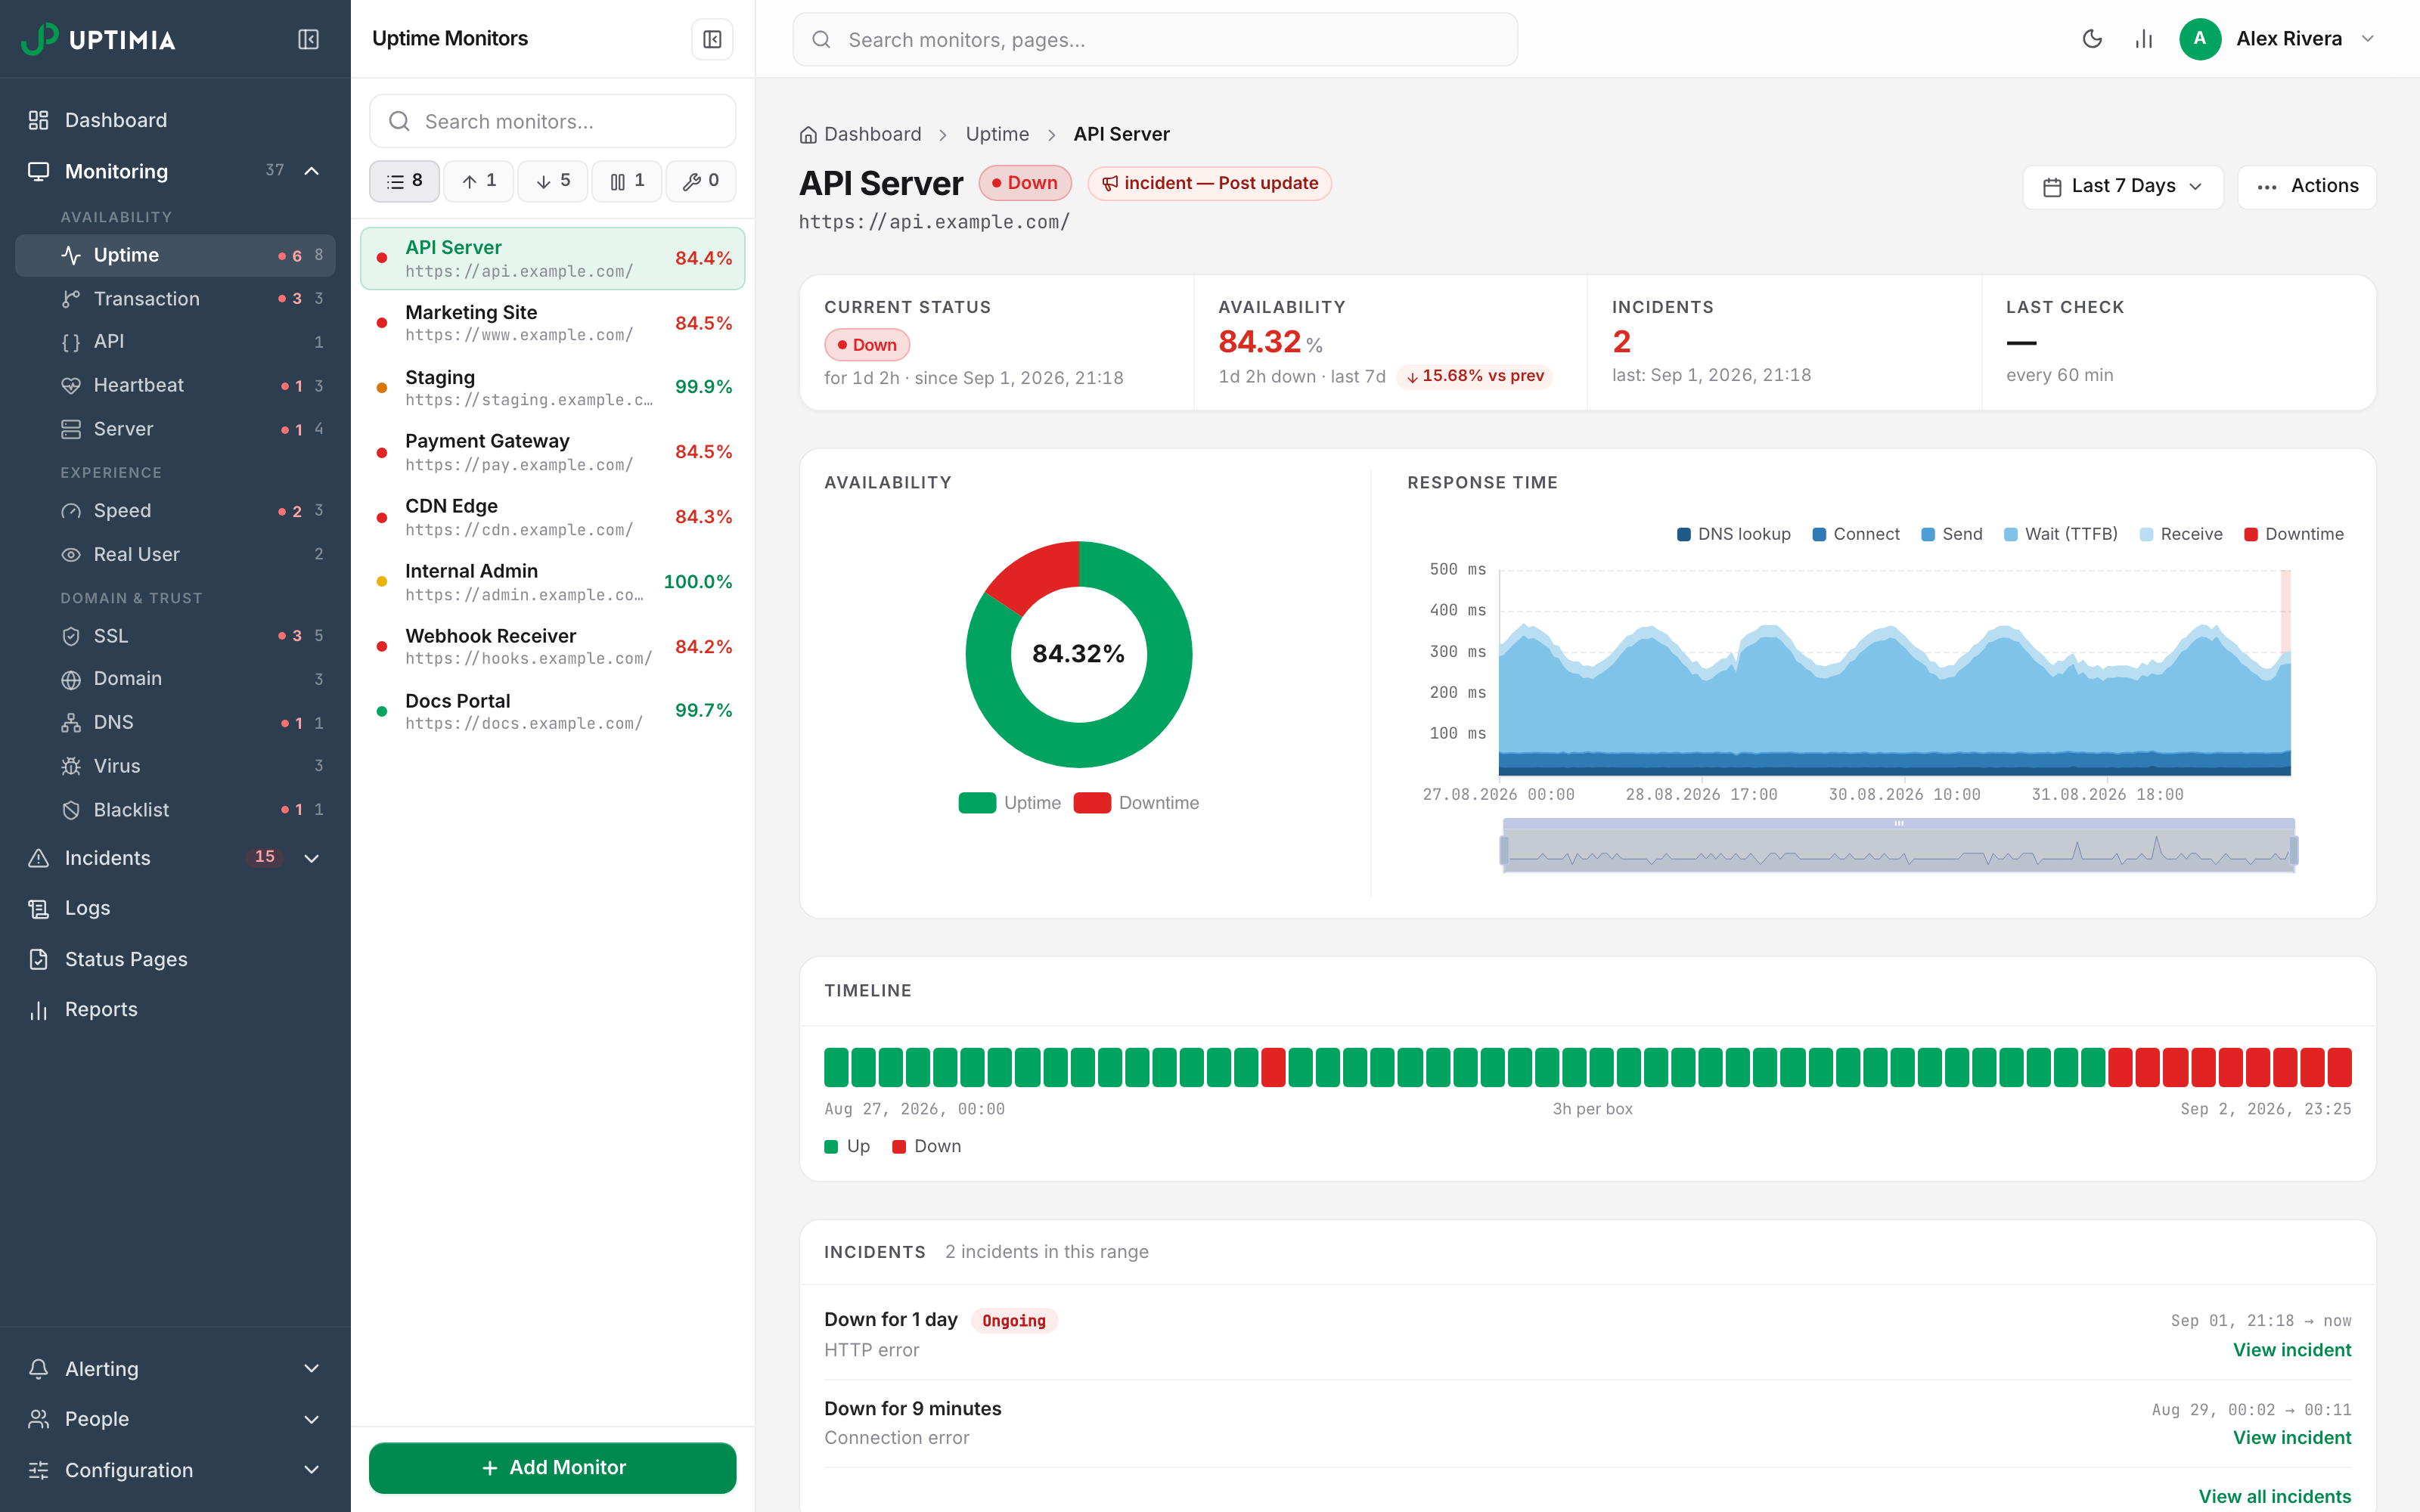
Uptime monitor details and response time breakdown
One monitor's current status, availability for the chosen period and its incidents. Response time is split into DNS lookup, connect, send, wait (time to first byte) and receive, which shows where a slow request spends its time.
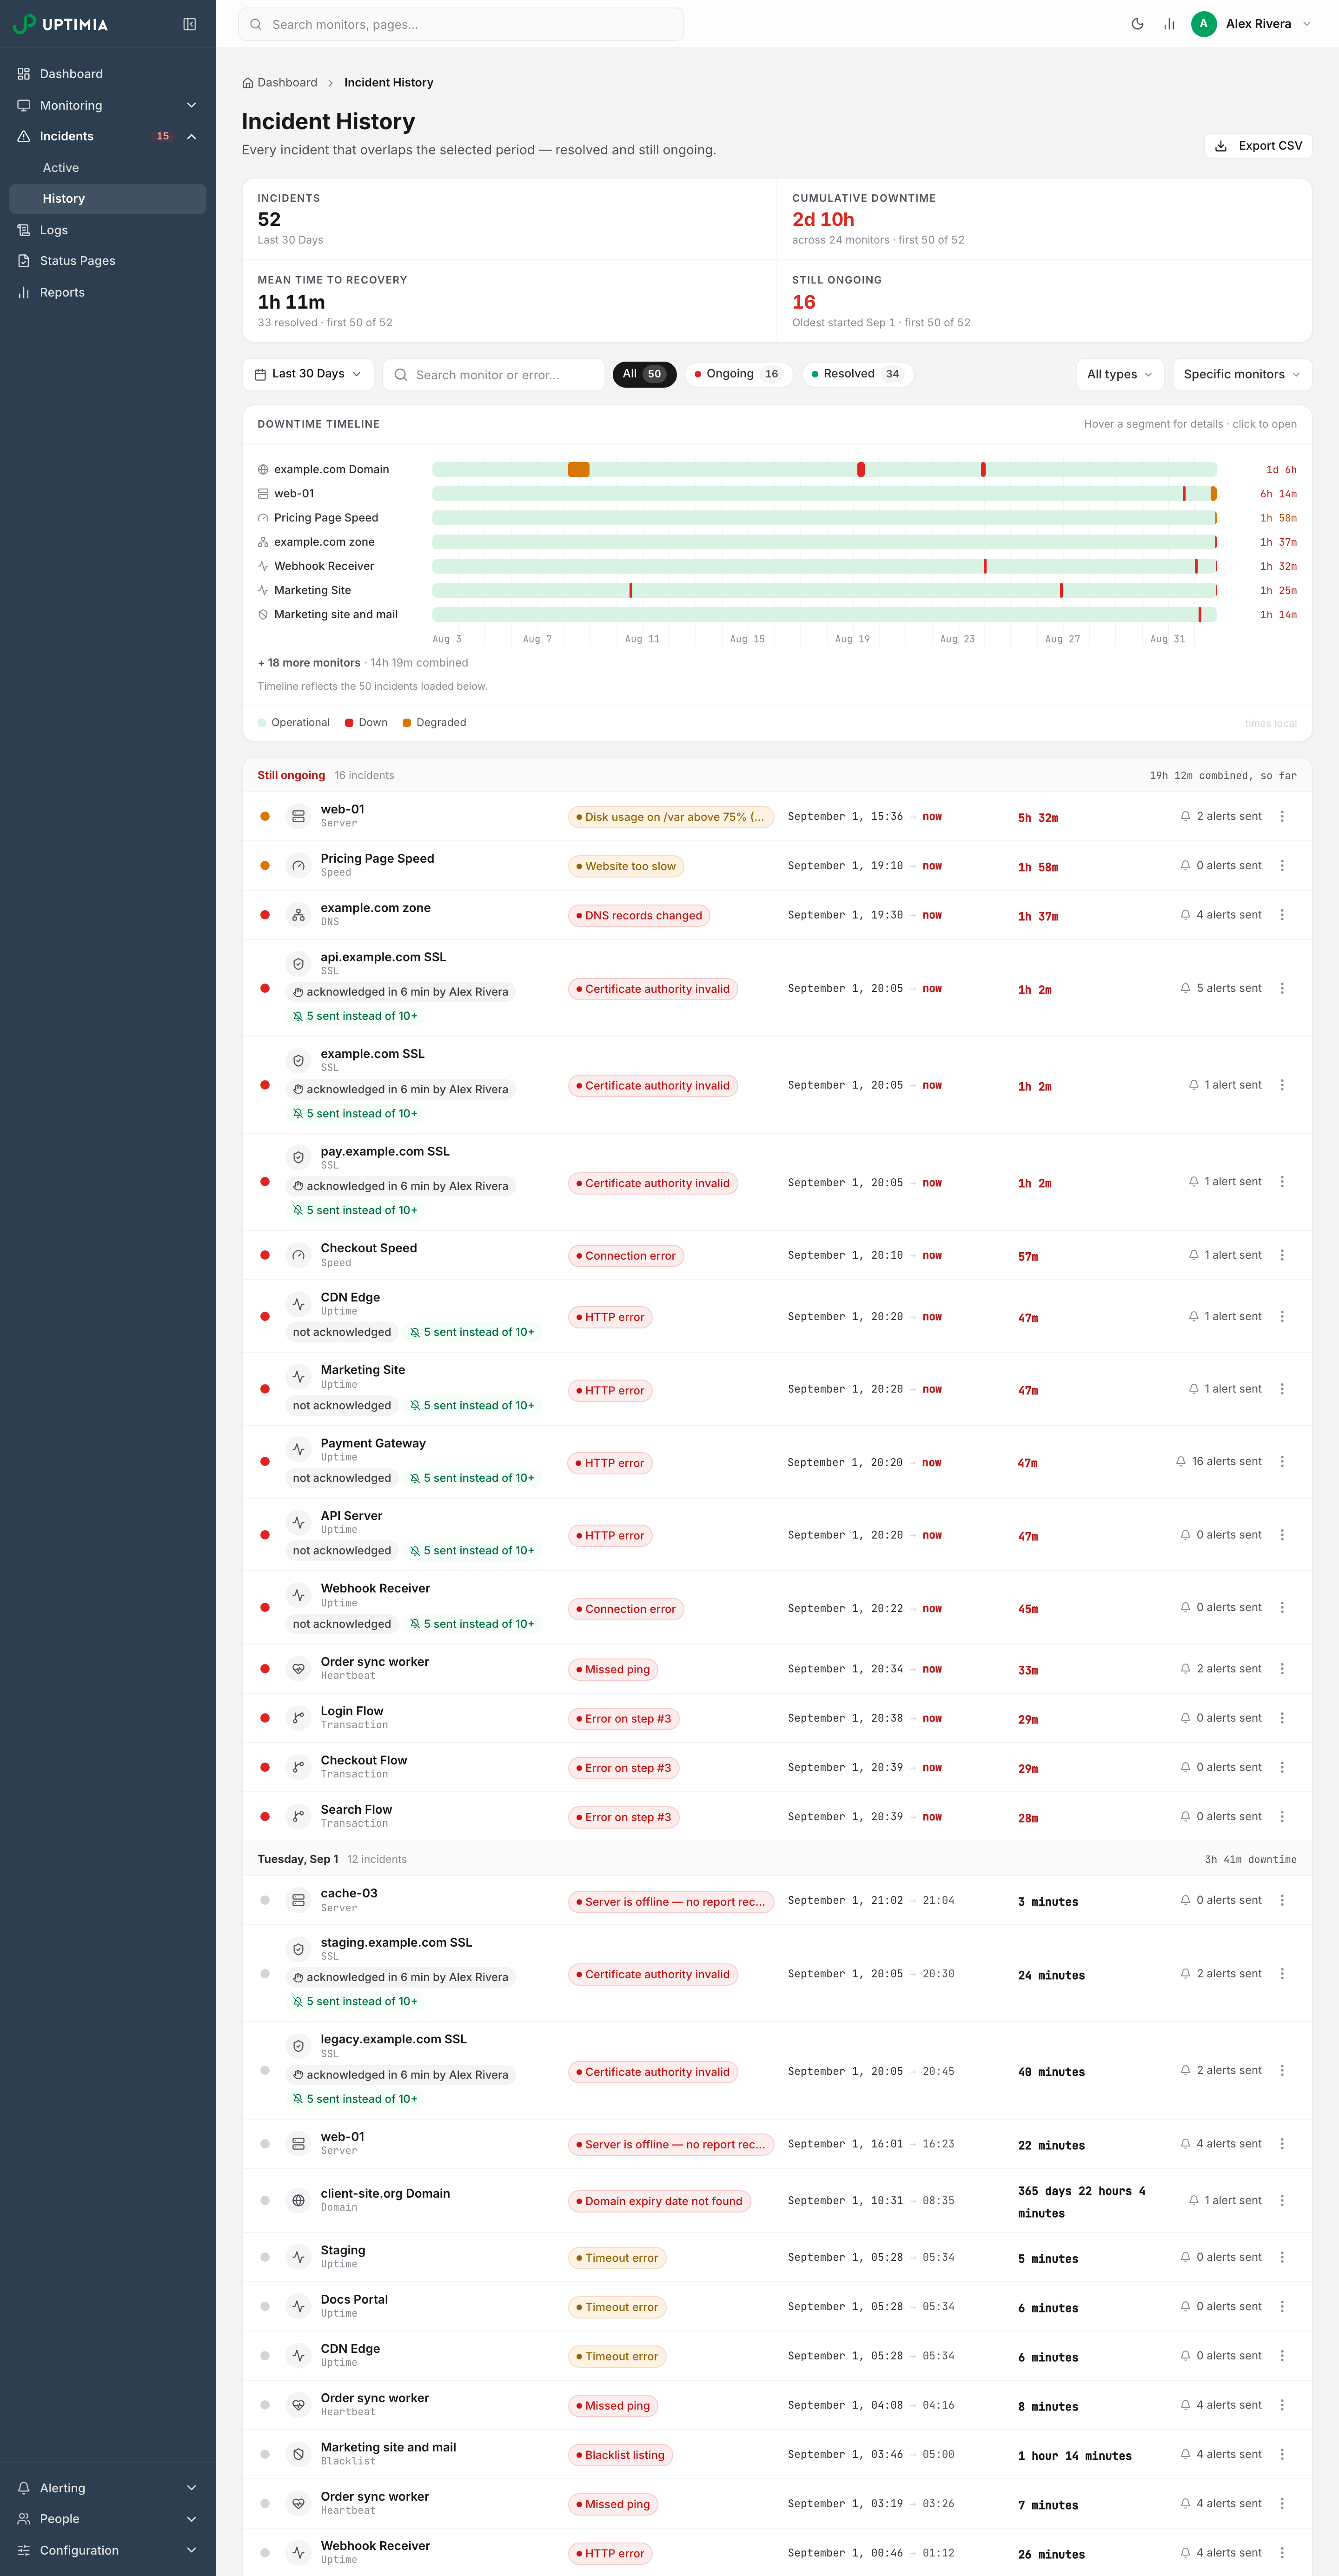
Every resolved and ongoing incident in a date range. Totals for downtime and mean time to recovery sit on top, with a downtime timeline per monitor, who acknowledged each alert and how many alerts were sent. Exports to CSV.
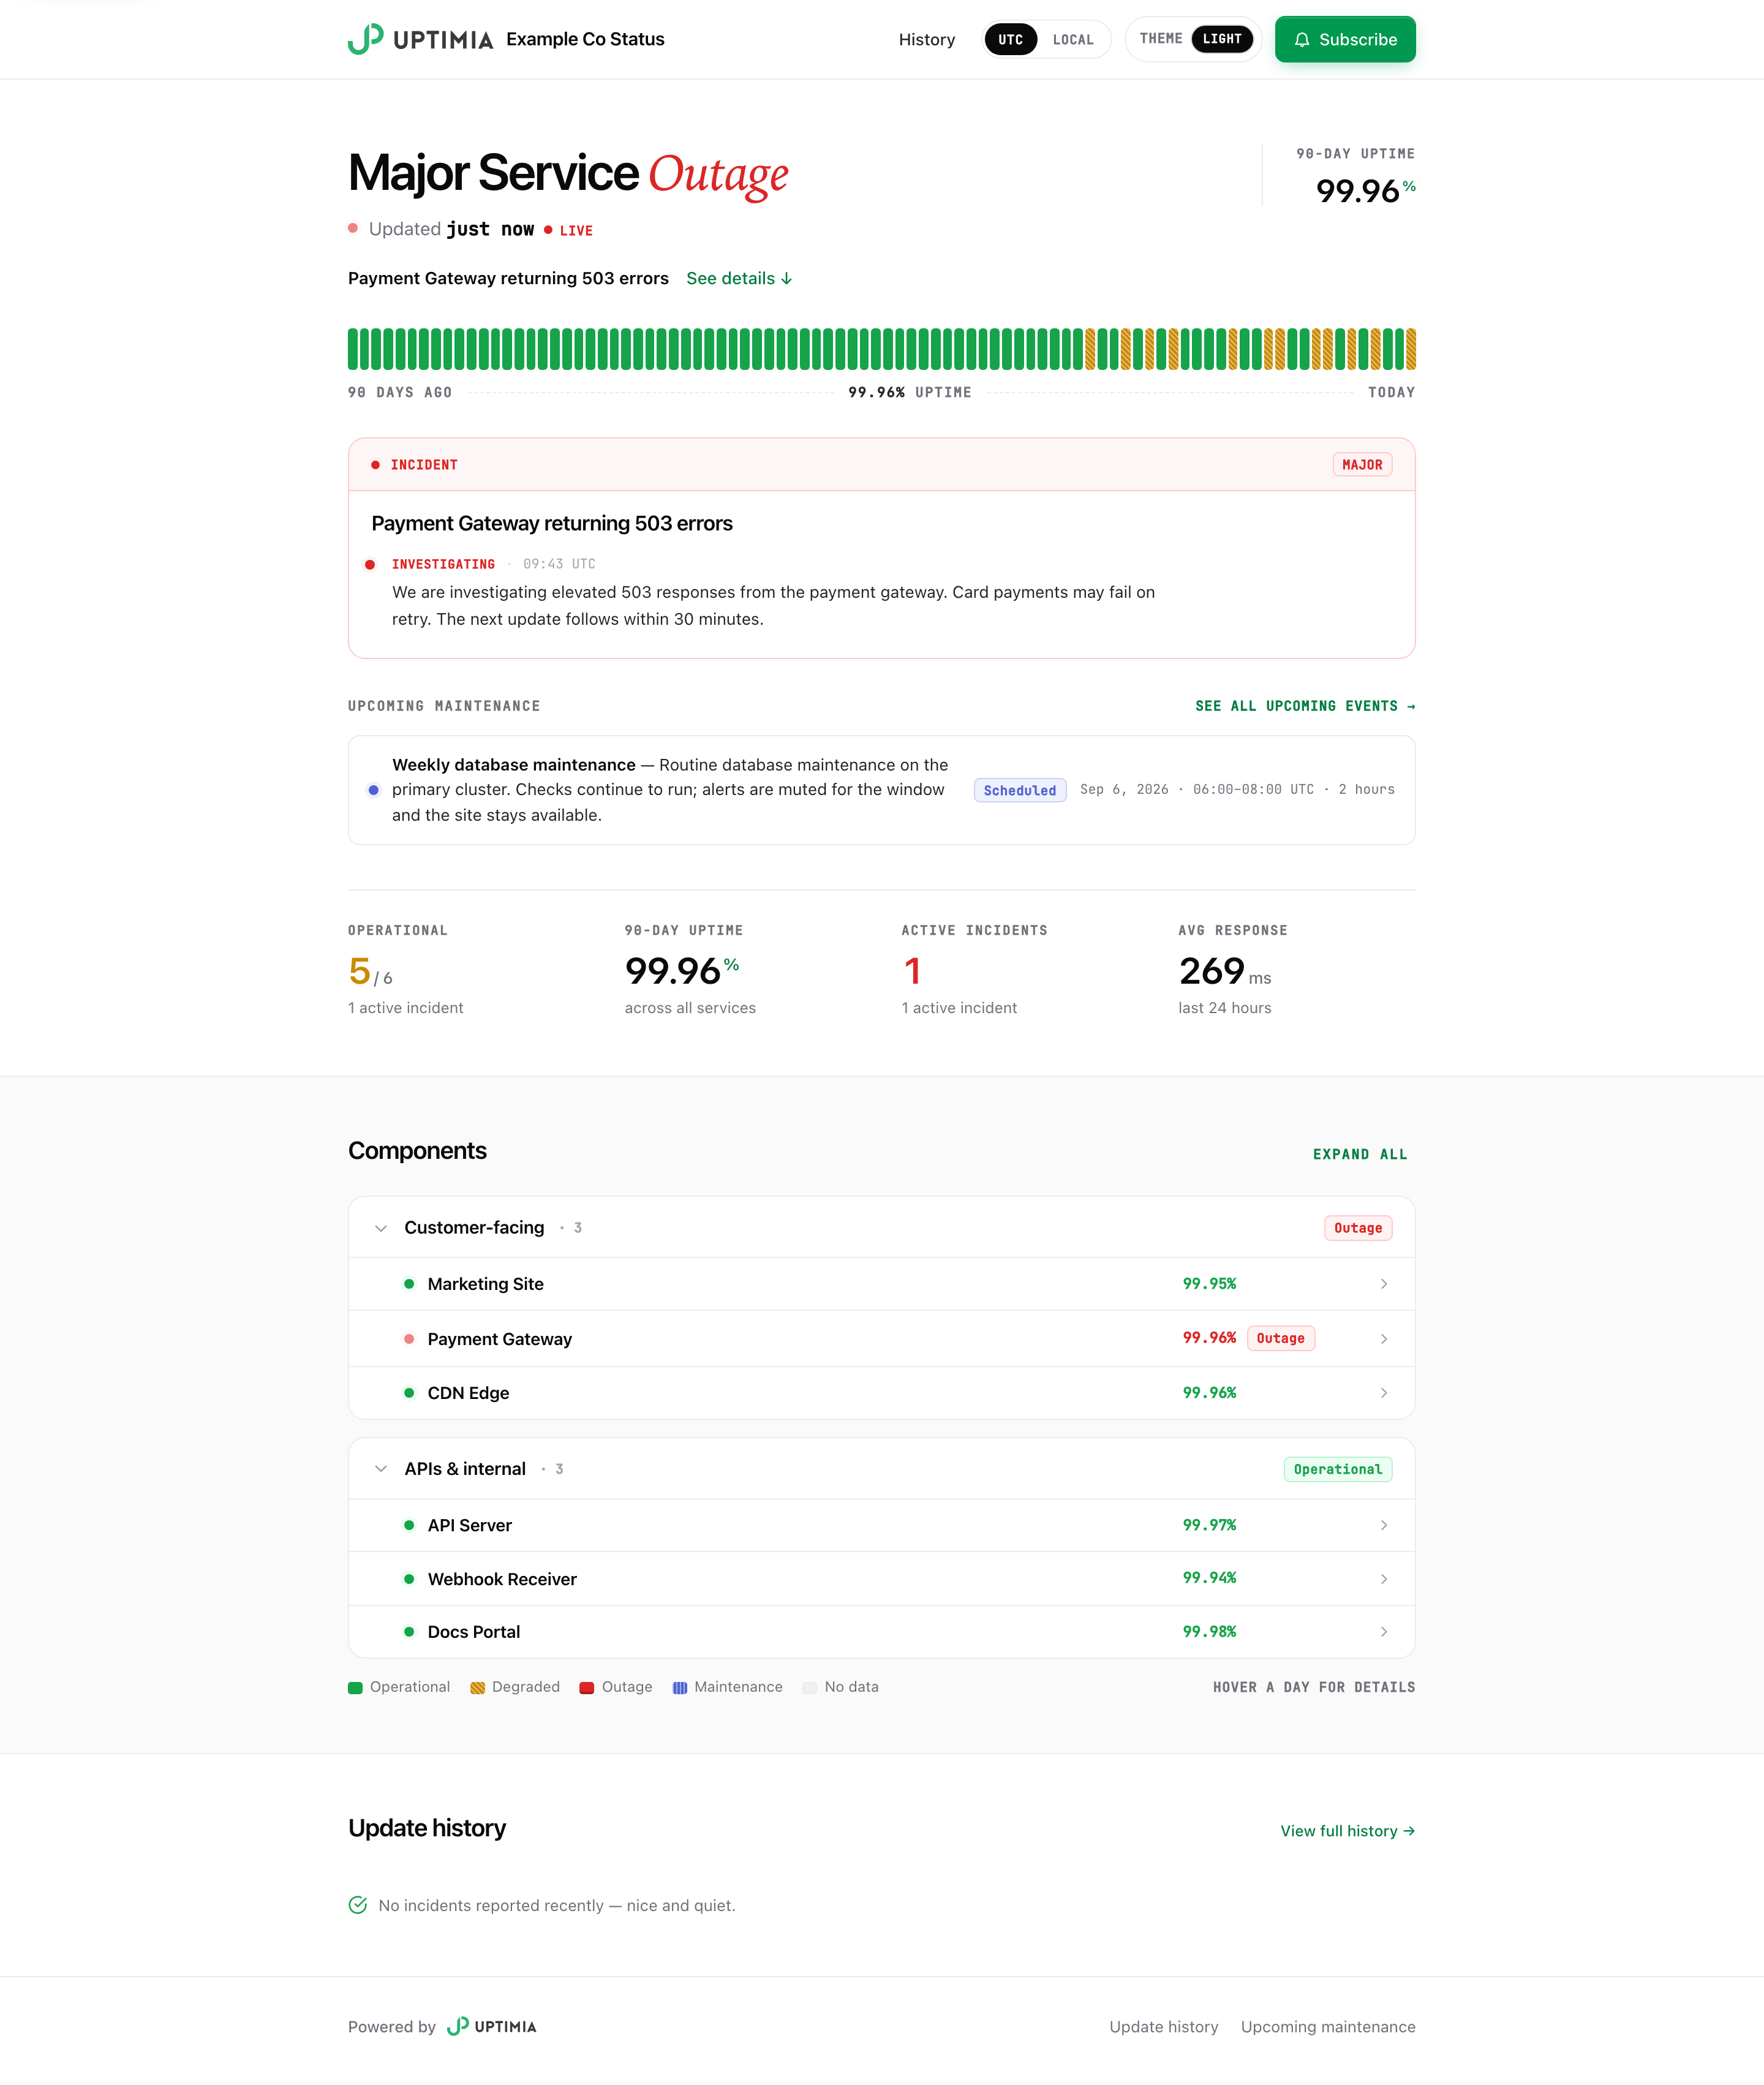
90-day uptime bars for each component, live incident updates and planned maintenance. Visitors can subscribe, switch between UTC and their local time, and choose a light or dark theme.
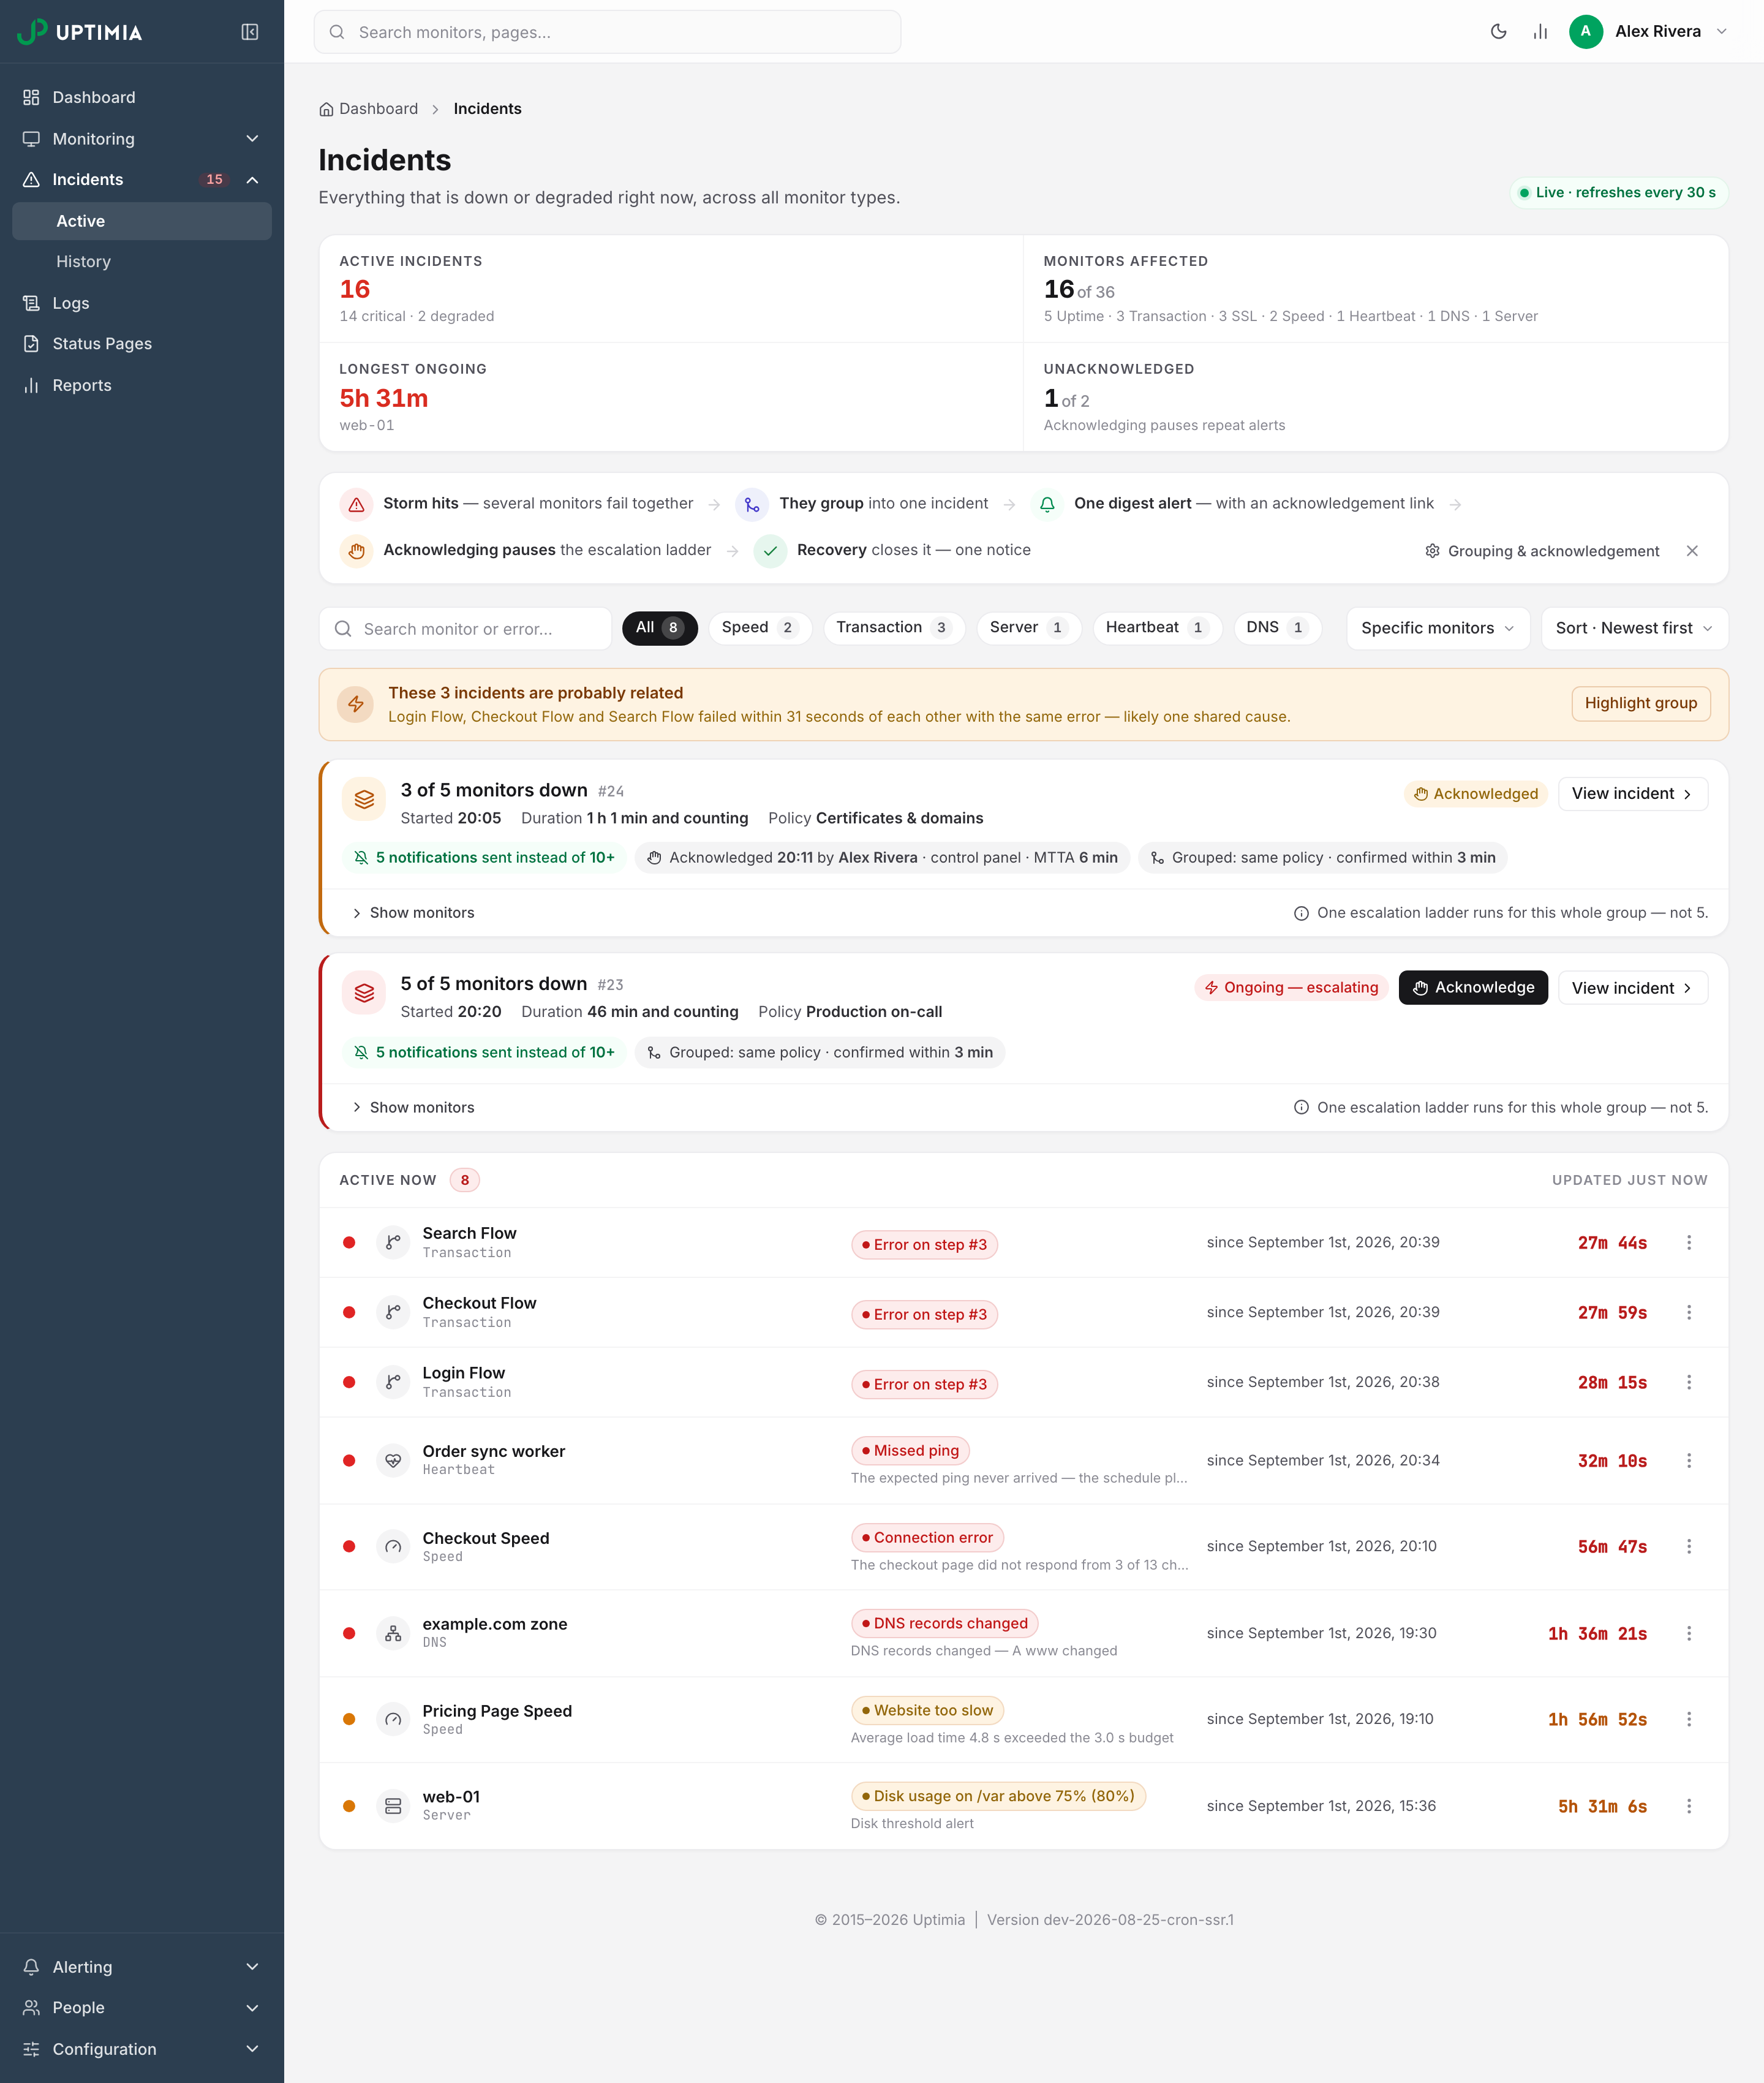
Active incidents with alert grouping and acknowledgement
Monitors that fail together land in one incident with one digest alert. Acknowledging it pauses escalation. Failures that look related are flagged, so the shared cause is quicker to find.