Complete website monitoring. One dashboard. One bill.
Catch problems before your customers do — without juggling multiple monitoring tools. Uptimia replaces the patchwork most teams end up with, for one fair price.
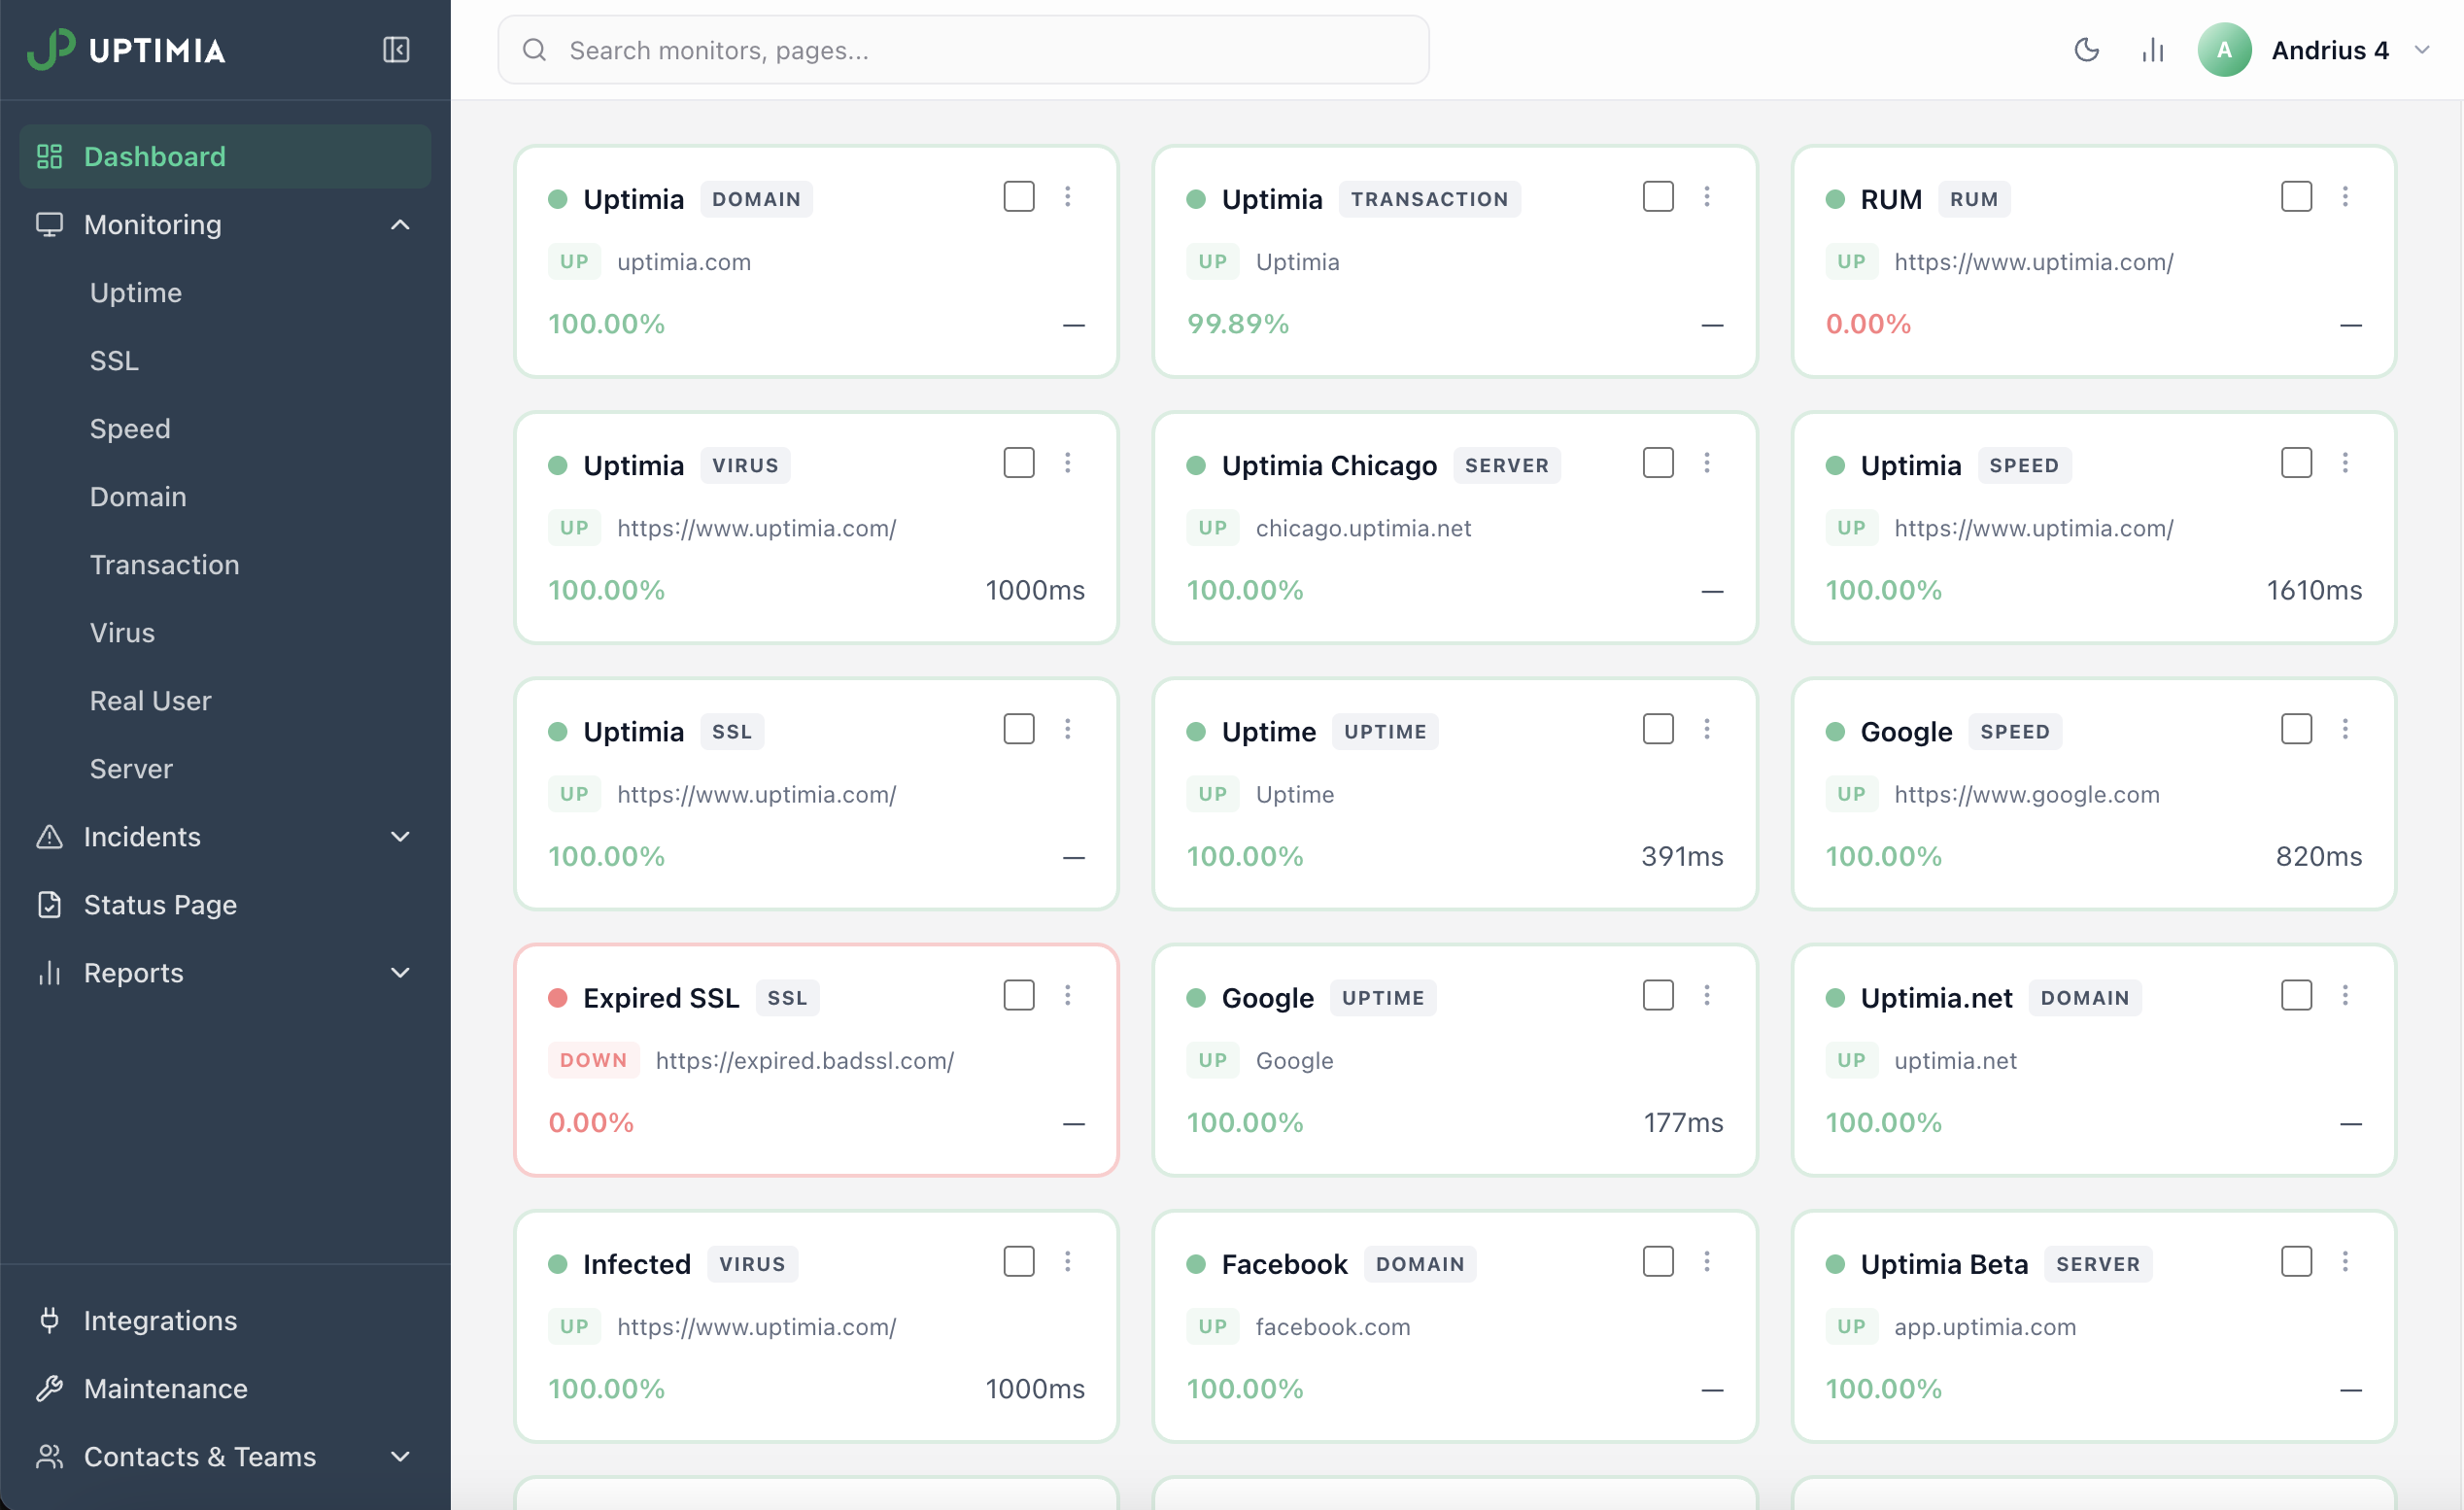
Everything you'd otherwise buy separately.
Uptimia bundles the monitoring tools most teams cobble together — under one dashboard and one bill. Pick one below to dive in.
Verified uptime and alerts you can trust.
Every failure is verified across multiple regions before anyone gets paged. No more 3 AM false alarms because one EU node hiccupped.
- 171+ checkpoints across 70 countries
- 30 s — 60 min check intervals
- Keyword presence & absence checks
- SMS · voice · Slack · PagerDuty · webhook
- Custom headers, basic auth, redirects
- Confirmed from 3 regions before alerting
Replay your critical user flows. From Frankfurt. From São Paulo. From Tokyo.
Build your critical flows step by step with our transaction builder, then replay them from every region. We capture a screenshot at every step — so when something breaks, you see exactly where.
- Intuitive transaction builder · no code required
- Up to 50 steps per scenario
- Form fills, clicks, waits, assertions
- Screenshots of every step
- Authenticated flows (cookies, headers)
- Run from any of 70 countries
What synthetic checks miss, your real users will tell you.
A one-line snippet captures every page load, every country, every browser — broken down so you can finally answer "is the site slow?" with data.
- Real-user page load times (p50, p75, p95)
- JavaScript errors caught in production
- Per-page, per-country, per-device
- Cookieless and GDPR-friendly
- Single 6 KB script
- Trends over weeks, not minutes
- No sampling — every session counted
Know the moment your site gets too slow — from every region.
Real Chrome browsers fully load your page from every region on a schedule. When the average load time crosses your threshold, we alert you — before slow days quietly become slow weeks.
- Performance & accessibility scores
- Per-location load times — find your slowest region
- TTFB, DOM, and full page load timings
- Trends across weeks
- Alert when average load time crosses your threshold
- Minimum 6 monitoring locations
Never explain another expired certificate to your CEO.
Daily checks from multiple regions. You choose when to be warned — and a critical alert always fires 3 days before expiry. Certificate chain issues, weak ciphers, and self-signed traps — all caught early.
- Expiry, chain, and hostname mismatch
- Wildcard & subdomain coverage
- Cipher & protocol audit
- Self-signed & revoked detection
- Choose your warning window + auto critical alert at 3 days
- Per-region check — flags certs that fail in specific regions
WHOIS-backed expiry reminders before a missed renewal costs you your domain.
Every domain you add gets daily WHOIS verification and a clear runway of reminders — all under one roof.
- WHOIS expiry across all TLDs
- Daily WHOIS checks with last-modified detection
- Choose your warning window + auto critical alert at 3 days
- Detail view: TLD, zone, and last-modified date
- Incident logged whenever WHOIS records change
From paste-a-URL to
peace of mind in 60 seconds.
No agents, no DNS changes, no SDK installs. Add what you want to watch, set up your alerts, and get on with your day.
Add what matters
Paste a URL. Uptimia starts watching in seconds.
Pick how you'll know
Slack, PagerDuty, Discord, MS Teams, WhatsApp, Telegram, SMS, webhooks. Different rules per monitor, with quiet hours and escalations.
Get back to building
Daily, weekly, monthly reports. Public status pages. Incident timelines. Everything ships with sane defaults.
The 4 minutes between
a glitch and a customer's tweet.
Here's what happens between “something flickers” and “everything’s fine again” — without you lifting a finger.
Detection
Frankfurt checkpoint is seeing a 502 from /checkout.
Confirmation
Dublin, London #2, and Amsterdam confirm — three more checkpoints see the same 502. Not flapping.
Page on-call
Slack → SMS to Sara → PagerDuty escalation fires if no ack within 5 min.
Recovery
All four checkpoints back to 200 OK. Incident closed, log preserved.
30 seconds to a working monitor — no card required.
Built for the way
you actually work.
Every role on your team gets a workspace that fits how they think — and tools that fit how they ship.
Wire it into the stack you already trust.
A REST API and webhooks with payloads you'd actually want to parse — pipe Uptimia into the systems that already wake you up.
- REST API — every monitor, incident, and log accessible programmatically
- Webhooks on every monitor event — pipe alerts to Slack, PagerDuty, or your own endpoint
- Per-user API keys — generate, rotate, and revoke from settings
- JSON in, JSON out — payload shapes you can write tests against
{
  "data": [
    {
      "id": 412, "name": "Checkout flow",
      "is_up": true, "is_critical": false, "is_trouble": false,
      "is_suspended": false, "is_paused": false, "is_maintenance": false,
      "groups": [{ "id": 1, "name": "Production" }]
    },
    {
      "id": 287, "name": "Marketing site",
      "is_up": true, "is_critical": false, "is_trouble": false,
      "is_suspended": false, "is_paused": false, "is_maintenance": false,
      "groups": []
    }
  ],
  "metadata": { "total": 12 }
}
Reports your stakeholders actually read.
Scheduled reports straight to stakeholders' inboxes — plus clean incident timelines, so you can stop translating between engineering and the exec team.
- Reports on any cadence — daily, weekly, monthly, quarterly, yearly
- Delivered straight to stakeholders' inboxes
- Full incident timelines — every check, alert, and resolution timestamped
- Public status pages — keep customers informed without writing a single update
- Your branding on reports and status pages — colors, logo, the lot
Sleep through the night. Be the first to know.
You just want to know if your site works. We'll tell you fast, in plain English, wherever you already are.
- No technical jargon. Plain-English alerts, not "LCP p75 2.9s EU-W"
- Paste a URL. Done. No agents, no DNS changes, no developer needed
- SMS, email, WhatsApp. Get alerts where you'll actually see them
- Never forget to renew. Domain & SSL warnings — default 30 days out, set your own window, critical at 3 days
- Share a link, not a screenshot. Public status page that updates itself
Monitor every client from one workspace — with your brand on it.
White-label everything your clients see — status pages, reports, and incident alerts. Add or edit hundreds of monitors in bulk via the dashboard or API.
- White-label status pages — status.yourbrand.com, your logo, zero Uptimia branding
- Branded client reports — your colors and logo on every weekly/monthly PDF
- White-labeled alert emails — clients see your name on every incident, not ours
- Bulk monitor ops — add or edit hundreds at once via the dashboard, or fully automate with the API
Your status page,
in your customers' language.
When something goes wrong, your status page is how you communicate with confidence. Beautiful, on your domain, fully translated. No other monitoring tool takes this seriously. We do.
- 8 languages · auto-detected per visitor
- Custom domain · status.yourbrand.com
- Subscribers via email, SMS, or RSS
- Branded with your logo & colors
- Embed on your homepage as a widget
Upstream payment provider is degraded. We're failing over to the secondary lane — most checkouts will complete on retry.
Replace the patchwork.
$443 saved every month.
Five specialist tools run about $488/month at list price at this scale — and that's before SSL and domain expiry monitoring, which none of them include. Uptimia Professional covers all seven jobs for $45 a month — $39 if you pay yearly.
- Pingdom Uptime monitoring · 100 monitors $120/mo
- Statuspage.io · Startup Branded status page $99/mo
- SpeedCurve Page-speed monitoring $90/mo
- Checkly · Team Transaction monitoring $80/mo
- LogRocket · Team Real-user monitoring $99/mo
- Uptime monitoring
- SSL monitoring
- Domain monitoring
- Page-speed monitoring
- Multi-step transactions
- Real-user monitoring
- Public status pages
Connect the tools you already use.
12 integrations across chat, on-call, SMS, voice, status pages, email, and webhooks. Alerts reach your team wherever they already work — in your language, on the channels they already check.
171 checkpoints worldwide.
Real checks where your users are.
From São Paulo to Singapore, every checkpoint runs on a dedicated IP — not shared serverless — so the latency you see is the latency your customers feel.
Fair pricing.
Every monitoring type, every plan.
No “agency tier” upcharge. No “premium” SSL add-on. Uptime, SSL and domain monitoring ship in every plan — you pay for scale, not surprises. Cancel anytime.
- 10 uptime monitors
- 1-min check interval
- 1 advanced check
- 1 status page
- 1 user
- 100 uptime monitors
- 30-sec check interval
- 10 advanced checks
- 10 status pages
- 10 users
- 1,000 uptime monitors
- 30-sec check interval
- 100 advanced checks
- Unlimited status pages
- 100 users
Questions,
answered.
The questions most teams ask before signing up.
What happens when my trial plan expires?
We’ll remind you a few days before your trial ends. If Uptimia has earned it, upgrade to a paid plan — and if not, your account simply moves to the free plan: one website, checked as often as every 5 minutes. No surprise charges.
Do you offer a free plan?
Yes — one website, checked as often as every 5 minutes, free forever. The free plan doesn’t include transaction, page-speed, or real-user monitoring; those start with the paid plans.
Can I upgrade or downgrade my plan?
Anytime, straight from your control panel.
What are the benefits of an annual plan?
Annual billing saves up to 13% — over a month and a half of service free each year.
My needs are bigger than your enterprise plan. What should I do?
Talk to us — we’ll put together an individual plan that fits.
What kind of payment methods do you accept?
Visa, Mastercard, American Express, and PayPal.
Try it on your own site.
You'll know in a minute.
Free for 30 days. No credit card. Full platform during your trial — every engine, every region, every channel.